Screen Screen Screen Screen
PRODUCTS

Gearbox Insight

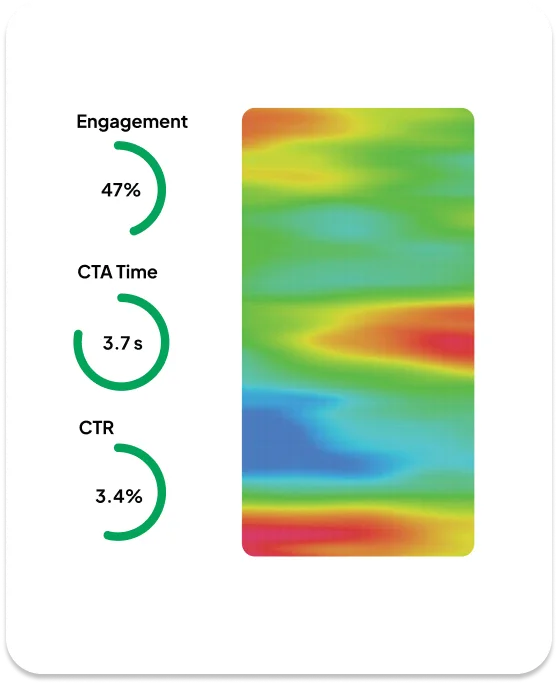
Gain deeper insight into your advertising campaigns with Gearbox Insight. Our powerful product makes it easy to track the performance of all your creatives with customizable metrics and smart graphics. With Gearbox Insight, you'll have the data you need to optimize your advertising and drive conversions.

Request Demo

Why use Gearbox Insight?

Easy to use Interface
Historical Datas to Analyze
Customizable Charts & Graphs
Detailed Heatmaps
Dozens of different parameters
Comparing Games and Versions
Gearbox Placeholder
Easy to use Easy to use Easy to use Easy to use
Charts, Numbers and Heatmaps Will Talk to You!

Gearbox Insight is an analytics platform that helps advertisers analyze creative performance using customizable metrics and graphics. It offers a comprehensive view of important metrics, such as CTR rate, playtimes, win/lose rates, and detailed heatmap data. Advertisers can compare performance and gain insight into player behavior to optimize game performance. Gearbox Insight provides the necessary data and products for actionable decisions, driving engagement and revenue growth.

Request Demo
Video Thumbnail
Frequently asked questions
What metrics and parameters can be tracked for playable ads?

On the Insight page, you can track dozens of metrics of your games such as CTR rate, impressions, win/lose rates, first interaction rates, count of CTA clicks, playtimes, heatmaps etc.

Is it possible for me to analyze historical data?

It is possible to analyze all data from the moment your creative is published.

Can the datas in Insight be downloaded?

Of course! You can prepare your data in the date range you want, then download this data and make detailed calculations on sheets.

What is heatmap?

Heatmap is a Gearbox feature that visually shows you at what second, on which part of the screen, and how often users interact with your creative.

Can I compare my games and versions on the same chart?

It is possible to compare your versions, games, bases in the compare table for the date range you want and see them on the same graph.